Six years building a BI practice · Part 1
Year one: turning Power BI into a product
How a client area and a full move to Power BI turned BI into a product at a consulting firm for schools, and how I would plan that first year today.
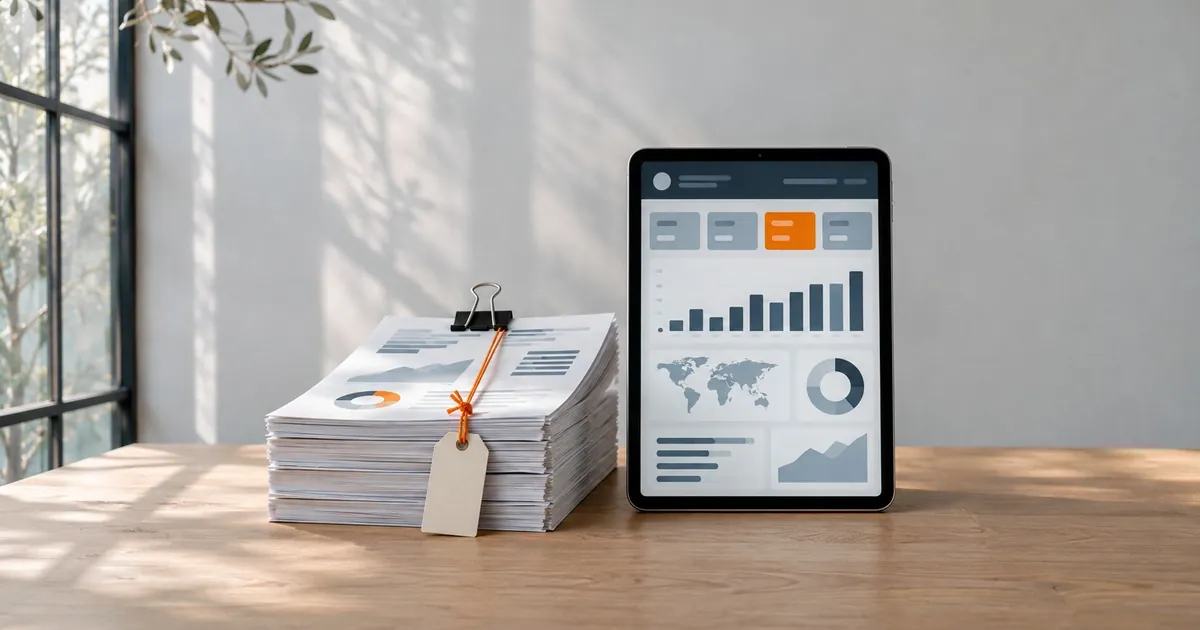
My first year at a consulting firm for private schools in Brazil started with two jobs that looked separate. The first was to build a client area, a place where schools could see the results of the work we did for them. The second was to migrate everything the company had produced into Microsoft Power BI. I ended up doing both at once, and that turned out to be the right call.
This is the first chapter of a six-part series. If you want the whole arc before the details, start with Six years building a BI practice from scratch.
Two jobs that were really one
A client area is only as good as what it shows. A portal full of files nobody opens does not change how a client sees your work. The migration to Power BI gave the client area a reason to exist: instead of fixed numbers, school managers and owners got interactive reports they could filter, slice and come back to.
It was a year of intense work and a lot of learning. The move changed the way we presented data and, more importantly, it changed what clients thought they were buying. They noticed the clearer, interactive views quickly, and they valued them. By the end of the year we had grown 50%, and BI was part of the firm's portfolio of services instead of something that came bundled with a consulting report.
What a BI system is made of, seen from year one
Textbooks describe a BI system in layers. It is worth looking at those layers through what we actually had in that first year, because most small teams start in the same place.
- Data sources. Internal sources such as ERPs, CRMs and transactional databases, plus external ones such as market and public financial data. For us, the bases lived in Excel files. Moving them to SQL Server was the work of year two.
- ETL. Extracting data from each source, cleaning and formatting it, and loading it somewhere fit for analysis. Our data treatment processes would only move to Python, and become largely automated, in year four.
- Data warehouse. A central repository, built for querying, where data from different sources sits together. We did not have one yet. Building it was the core of years two and three.
- Analysis and visualization. Dashboards, reports and interactive charts, plus analytical tools on top of the model. This was where Power BI came in, and it was the only layer the client could see.
- End users. Analysts who explore, executives who decide, operational staff who act. In our case, the people on the school side making decisions with the reports.
So year one was built from the top down. We put the visible layer in place first and rebuilt what sat beneath it later. In a textbook that is the wrong order. When clients need to see value before anything else, it worked. The cost showed up later, and I describe it in From Excel to SQL Server: when spreadsheets hit a wall.
How I would plan that year today
With what I know now, there is a planning sequence I would follow from the first week. It fits a small team as well as a large one.
Start with the people, not the tool
Before choosing visuals, talk to everyone who will touch the reports: the people who pay for them, the people who decide with them and the people who feed them data. Then write down the business objective each report serves. Better decisions, less time spent on routine work, a new opportunity spotted earlier, a happier client. If a report cannot be tied to one of those, it is decoration.
Look at the process before the data
The best place to add BI is usually a step that already hurts: a number that takes days to assemble, a decision made without evidence, a recurring question nobody can answer quickly. Mapping the existing workflow shows where a report removes work instead of adding a new screen to check.
Collect requirements in concrete terms
Which reports, which dashboards, which sources, which metrics. It sounds bureaucratic, but a one-page list prevents the most common failure of a first BI project: a beautiful report that answers a question nobody asked.
Give every goal a number and a date
Goals should be specific, measurable, achievable, relevant and time-bound. "Better reports" is a wish. A goal names what changes, by how much and by when, so that at the end of the year you can say whether it happened.
Know which hats you are wearing
A full BI team has a project manager, a data architect, a data engineer, a BI analyst, a BI developer and someone responsible for data quality. In year one, a small practice has far fewer people than roles. Our first hire, an assistant, only came in year three. Listing the roles still helps, because it shows which ones you are covering, which ones you are skipping, and where the risk sits. Looking back, the roles we were shortest on were data architecture and data engineering, which is what years two to four went on to address.
BI as a product, not a deliverable
The biggest change of that year was not technical. When BI is a deliverable, it ends when the project ends. When it is a product, it has a life of its own: clients return to it, ask for more and judge the firm by it. That shift is what the 50% growth reflected, and it set the direction for everything that followed, up to the web portal with Power BI Embedded we built in year five.
What I would repeat, and what I would change
I would repeat doing the client area and the Power BI migration together. Each one gave the other a purpose, and clients felt the difference within the year.
I would repeat putting the visible layer first. It earned the trust that paid for the foundations.
I would make sure the plan is on paper from the first week: stakeholders, objectives with numbers and a list of roles. A few days of writing cost less than any rework.
And I would plan the move out of spreadsheets from day one, even if it only happened in year two. Knowing where the data is going to live changes how you build reports today.
If you are starting this first year now and want to talk through your own setup, send us a message.