The question
We start from the decision you need to make, not from the data you happen to have.
Solutions · 04
Studies built for one decision: where to open, what to charge, what your customers are telling you. Your data and public data crossed in Python and SQL, delivered as dashboards your team can explore.
The problem
Where to open and what to charge are decided by feel.
Survey answers pile up in spreadsheets nobody has time to read.
The data exists, but no one crosses one source with another.
What we deliver
How the tuition study worked is told in From Excel to SQL Server; how survey processing went from three a day to dozens, in Python for BI.
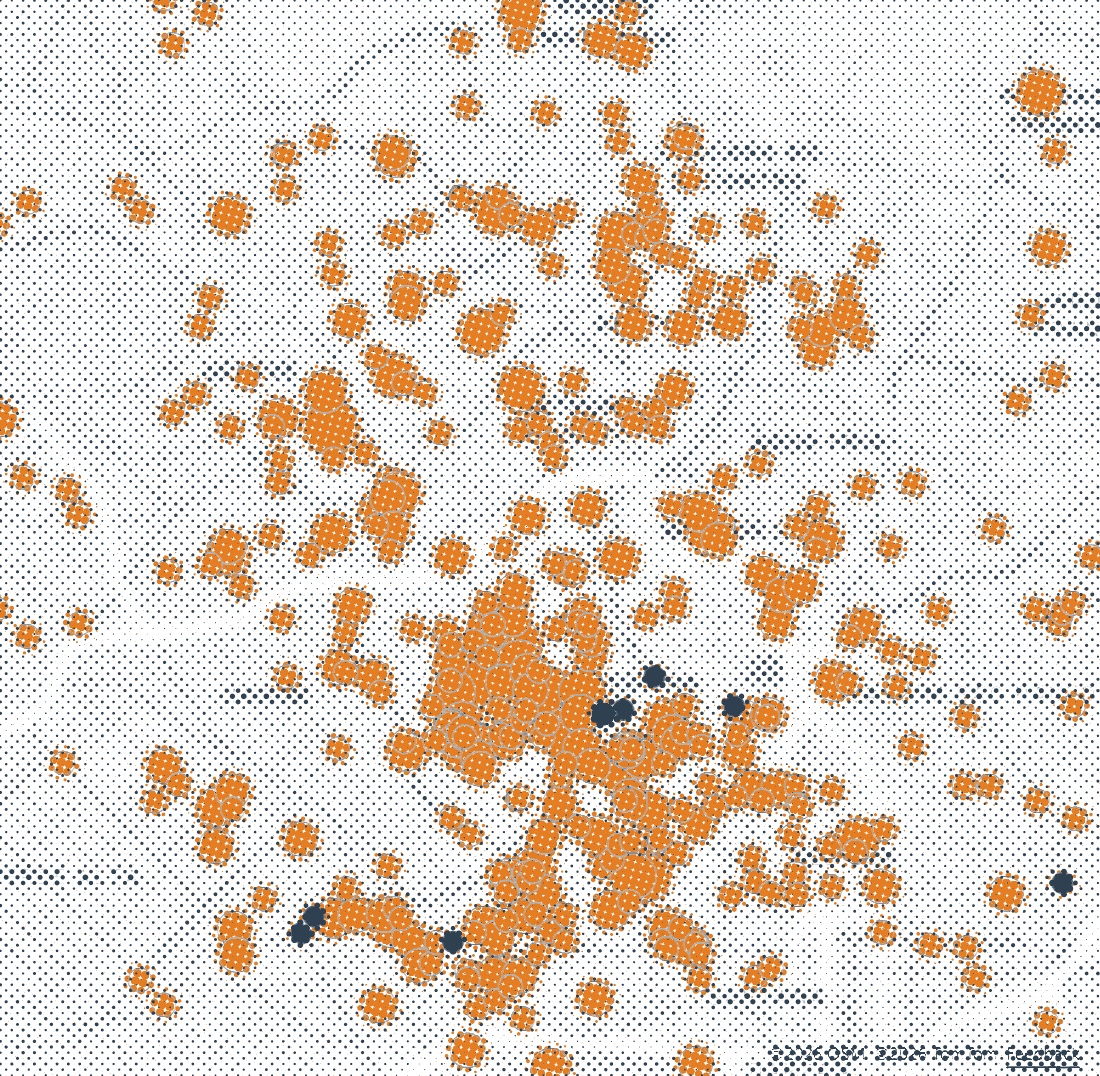
Demographic and economic data within a radius around each address, to read the market a location serves and where the competitors are. Built on Brazil's official open data.
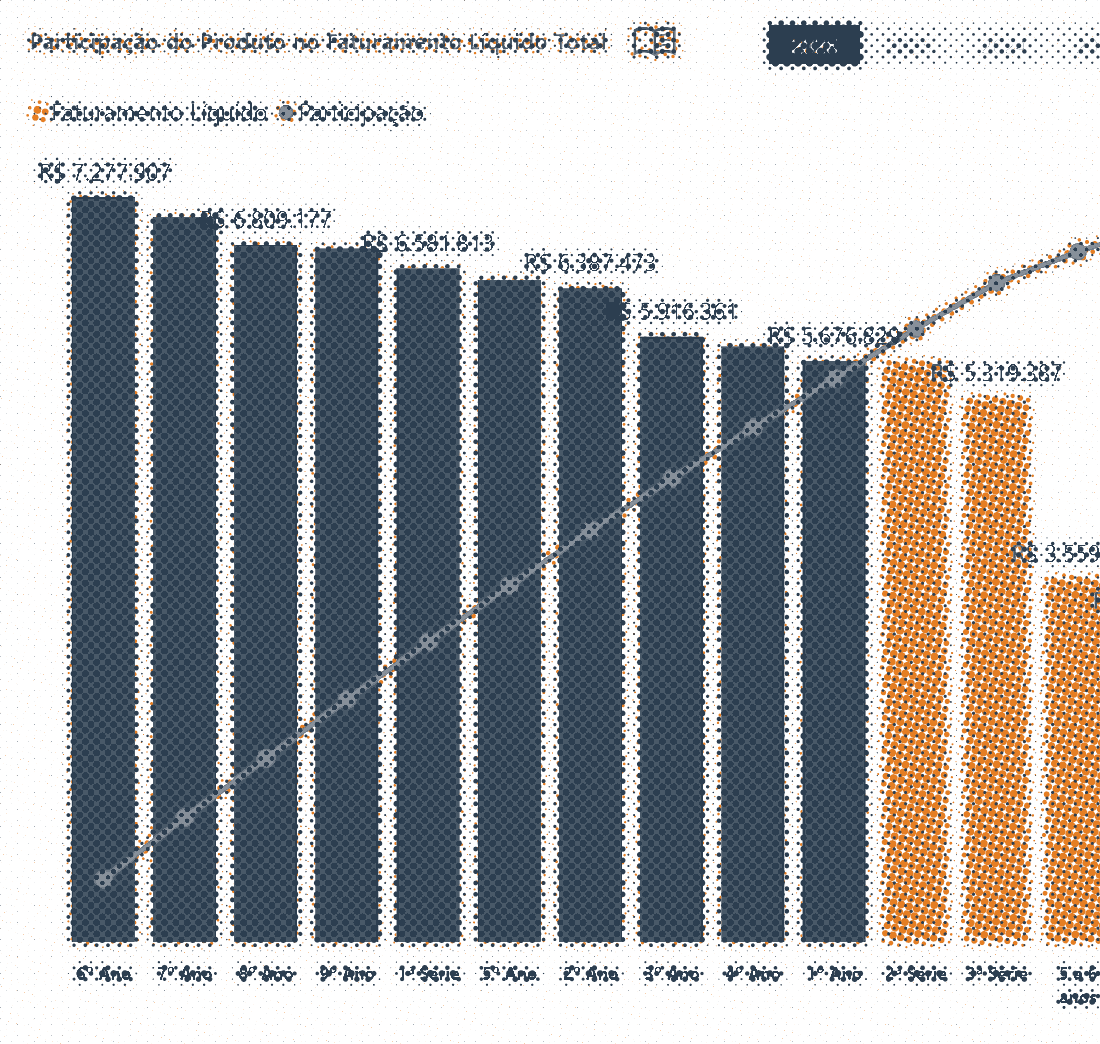
Your price compared with what households nearby spend, as we did for school tuition within 2 and 4 km.
Satisfaction and market surveys cleaned, coded and read in bulk. We process more than 59,000 a year.
Revenue by product, average ticket, acquisition and retention, modeled and presented in Power BI.
Python routines that clean and cross your sources on a schedule, so people fix exceptions instead of typing.
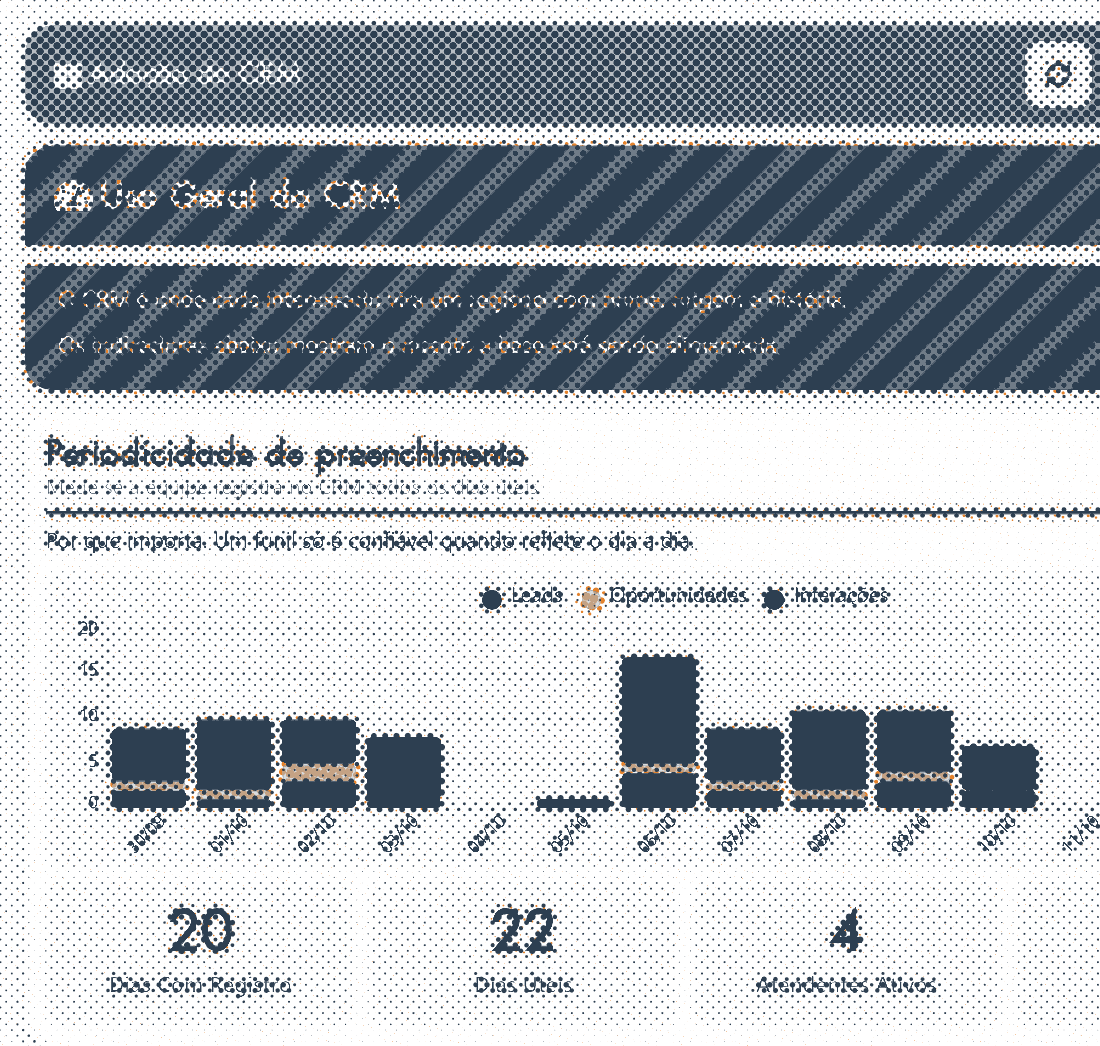
Each study ends in a dashboard on the bi19 platform or in Power BI that your team can filter and explore.
How we work
We start from the decision you need to make, not from the data you happen to have.
Your spreadsheets, databases and exports plus public demographic, economic and geographic data, crossed in one database.
Python and SQL, with the method written down, so every number can be traced back to its source.
A dashboard your team can explore, and the findings explained in plain words.
Projects
Power BI
Geomarketing
Business Intelligence
Tools
Questions
No. Cleaning and crossing the data is part of the work: we start from what you have, in spreadsheets, databases or system exports.
From official open sources: in Brazil, the national census and economic statistics. Every study states its sources and its method.
It depends on the open data each country publishes. Our geomarketing studies use Brazil's official census and economic data; for another country, we first check whether comparable data exists at the level of detail the study needs. Surveys, financial studies, data pipelines and dashboards work anywhere.
A dashboard your team can filter and explore, on the bi19 platform or in Power BI, and the method in writing.
Sow ideas, reap solutions.